Debugging Node.js applications is a crucial skill for any developer. It allows you to identify and fix issues in your code efficiently.
Using console.log()
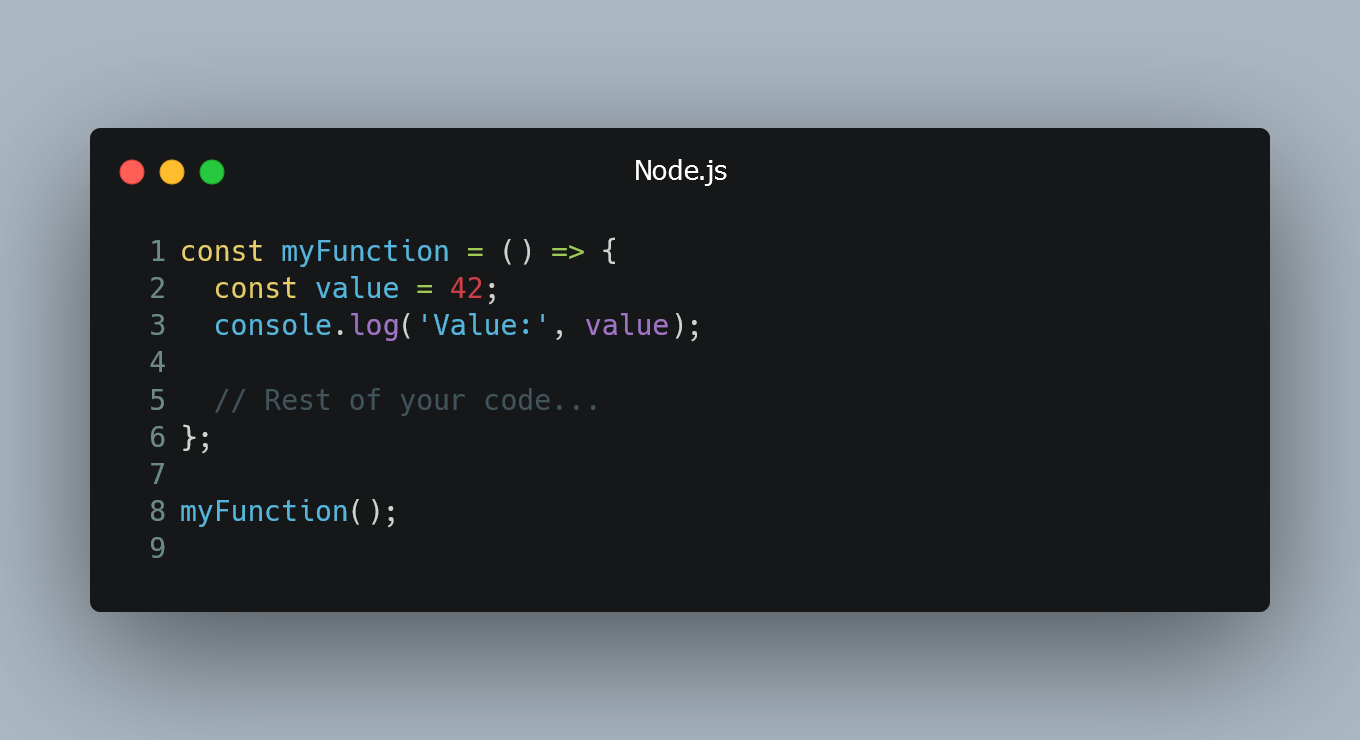
The simplest and most basic way to debug Node.js applications is by using console.log() statements. By adding console.log() at various points in your code, you can print out variable values or messages to the console to understand the flow of your program.
const myFunction = () => {
  const value = 42;
  console.log('Value:', value);

  // Rest of your code...
};

myFunction();
By examining the output in the console, you can trace the execution and identify any unexpected behaviors.
Using Node.js Debugger
Node.js provides a built-in debugger that allows you to set breakpoints, inspect variables, and step through your code. To use the debugger, start your Node.js application with the inspect or inspect-brk flag:
node --inspect index.js
Or, to pause the execution on the first line:
node --inspect-brk index.js
This will generate a URL, which you can open in the Chrome DevTools by navigating to chrome://inspect. From there, you can debug your application just like you would in the browser.
Using Visual Studio Code Debugger
If you prefer a more integrated debugging experience, you can use the Visual Studio Code debugger. First, install the "Debugger for Node.js" extension. Then, add breakpoints in your code by clicking on the left gutter in VS Code.
To start debugging, press F5 or click the "Run and Debug" button. The debugger will stop at the breakpoints, and you can inspect variables, step through the code, and use other debugging features provided by VS Code.
Using Node.js Inspector API
If you want to create custom debugging tools, you can use the Node.js Inspector API. This API allows you to programmatically access debugging-related features within your Node.js application.
const inspector = require('inspector');
inspector.open(9229, '127.0.0.1', true);
By using the Inspector API, you can build your own custom debugging tools tailored to your specific needs.
0 Comment

