This project provides a comprehensive monitoring setup using Docker containers. With a single command, make up, you can quickly deploy a base environment that includes dashboards, alerts, metrics, and logs, giving you a solid foundation for monitoring and observability.
About
Get your monitoring stack up and running with one command using a Docker Compose stack featuring:
- Grafana: Dashboarding.
- Prometheus: Timeseries database for metrics.
- Node-Exporter: Node metrics.
- cAdvisor: Container metrics.
- Alertmanager: Alerting system.
- Loki: Logs (including explore-logs).
Makefile
Note: Due to docker-compose and the compose plugin, you might have one of the two installed. I have a Makefile that will detect which on you have installed.
You can list the targets using make.
Boot
Boot the stack with docker compose (or make up):
docker-compose up -d
Ensure all containers are running:
docker-compose ps
The output should look like this:
    Name                   Command                  State               Ports
--------------------------------------------------------------------------------------
cadvisor        /usr/bin/cadvisor -logtostderr   Up (healthy)   8080/tcp
grafana         /run.sh                          Up             0.0.0.0:3000->3000/tcp
node-exporter   /bin/node_exporter --path. ...   Up             9100/tcp
prometheus      /bin/prometheus --config.f ...   Up             0.0.0.0:9090->9090/tcp
alertmanager    /bin/alertmanager --config ...   Up             0.0.0.0:9093->9093/tcp
loki            /usr/bin/loki -conf ...          Up             0.0.0.0:3100->3100/tcp
promtail        /usr/bin/promtail ...            Up
Access Grafana
Access grafana on Grafana Home (or make open) and you should see the three dashboards that was provisioned:

Once you select the Node Metrics dashboard, it should look something like this:

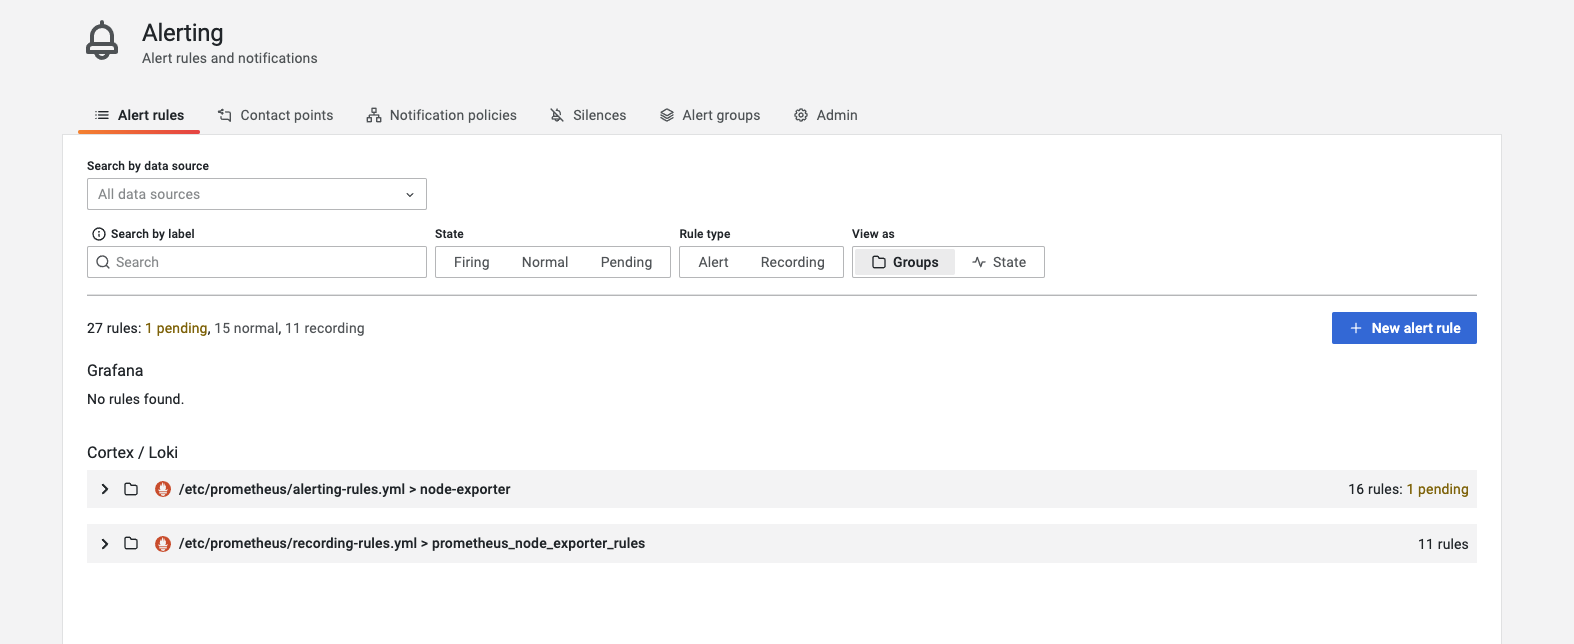
When you select "Alerting" and "Alert rules" you will find the recording and alerting rules:

We can expand the alerting rules:

And then we can view more detail on a alert rule:

And for our container metrics we can access the Container Metrics dashboard:

Then for our last dashboard, the Container Log Search, by default the metric panel will be collapsed, but to expand it for visibility it will look like this:

And we can also view our Container Logs in the explore section:

For discovering the Logs we can navigate to the Explore / Logs view:

Project on Github
If you would like to checkout this project, feel free to visit it and give it a star if you find it useful:
0 Comment

